As we’re fond of saying, corporate profits are the mother’s milk of stock prices, so every three months, as quarterly U.S. earnings reports come out, we’re busy watching and listening to see what trends are emerging and what companies have to say about the immediate past and about the near future. In the short term, stock prices’ reactions to companies’ earnings reports are unpredictable. In aggregate, and over the longer term, earnings (both actual and anticipated) are highly predictive of stock prices’ direction and of overall market performance. After all, earnings are why companies are in business. In the end, the macro trends and themes which we follow — social, technological, economic, and political — bear fruit (for good or ill) in earnings. The proof of the pudding is in the eating.
So how are earnings stacking up as we enter the third week of the current earnings season, with about half of the members of the S&P 500 having reported?
Estimates
First, relative to the expectations analysts had ahead of earnings, about 80% of companies are beating those estimates. Note that this says nothing about the absolute level of earnings — just whether companies are meeting or falling short of Wall Street’s consensus expectations. Expectations for Q3 2019 earnings have been steadily falling over the past year. But they’re beating a little better than usual, which implies that analysts’ expectations had gotten a little too negative. (Companies are also beating on reported sales, with about 65% above analysts’ consensus, also a higher beat rate than average.)
Also supporting the notion that the mood of analysts and of market participants had gotten a little too dark is the market’s reaction to beats and misses. Companies’ stock prices are getting punished for misses less than usual — and getting rewarded a lot better than usual (averaging a 1.7% rally for beats, versus a 0.5% historical average).
Earnings Growth
In the big picture, year-on-year earnings growth rates are still facing tough comparisons with 2018 earnings that were lifted by the 2017 tax cut. On average, reported earnings are up about 0.6% year-over-year.

Source: Deutsche Bank Research
We note that the median company is showing 6–7% earnings-per-share growth — which means that larger outliers are pulling the average down, and that underneath, the reality is better than that average would lead you to believe.
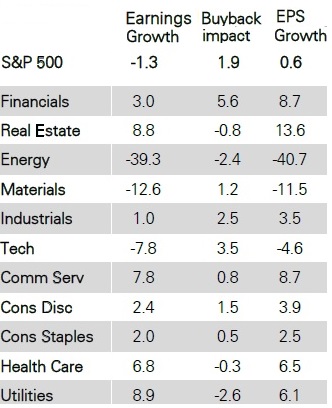
Additionally, there are wide divergences in performance among companies in different sectors. Energy and materials, as in 2015 and 2016, remain a big drag on S&P 500 earnings as a whole, creating the appearance of more sluggish index-wide earnings than appears when sectors are broken out.

Source: Deutsche Bank Research
Excluding energy and materials — which together only represent about 9% of the S&P 500 by market capitalization — S&P 500 earnings growth would be about 3.6%, down only slightly from the 3.7% logged in the second quarter. In our view, given that we are still lapping the immediate effects of the 2017 tax cut, this result is far
Some other interesting divergences that appear: services earnings growth is far outstripping manufacturing (+8.4% vs –8.2%), and consumer-oriented is far outperforming producer-oriented (+6.5% vs –7.5%).
In short, earnings growth is there. Even the drags on market-wide earnings from the underperforming sectors have not been severe enough to pull market-wide earnings into an overall “earnings recession” such as we saw in 2015 and 2016, and which had a challenging effect on stock-market sentiment and performance during that period.
Buybacks
The earnings that we’ve been discussing are reported earnings per share. Stock buybacks increase reported earnings per share by reducing the number of shares, and as we have observed frequently, such buybacks have been a decisive component of reported earnings growth and stock market appreciation during the whole post-2009 period.
So is it possible, then, that the positives we’ve noted about earnings so far are just an artifact of financial engineering?
In a word, no. Here’s a chart of the earnings season so far, to give you a sense of the impact that buybacks (or, in the opposite direction, issuance of new shares) has had on reported earnings:

Another way of looking at the table above is that even before taking buybacks into account, 71.1% of the S&P 500 by market capitalization is reporting year-on-year earnings growth. That does not sound like an earnings recession to us.
Investment implications: Earnings trends show that even as the U.S. market continues to lap the big one-time earnings increases of 2018, growth is still present and we have not entered an “earnings recession” like that of 2015 and 2016. Other things being equal, we would expect U.S. stocks to perform better than they did during that period. Under the hood, trends show that analysts had taken earnings down a little too far over the past 12 months. Further, while market-wide buybacks continue to increase reported earnings per share, most of the market is showing earnings growth before share buybacks are taken into account. On balance, then, third-quarter earnings reports are confirming us in the view that market pessimism became overdone, and that the U.S. economy is bottoming and turning up from the third period of slowing since the end of the Great Recession. We believe investors should stay invested in U.S. stocks, and not let themselves get spooked by lingering recession fears, political turmoil, or geopolitical conflicts.
